Transforming Your Dashboards - A Redesign Journey
- adrianzinovei
- Jun 20, 2024
- 2 min read
Hello Tableau enthusiasts,
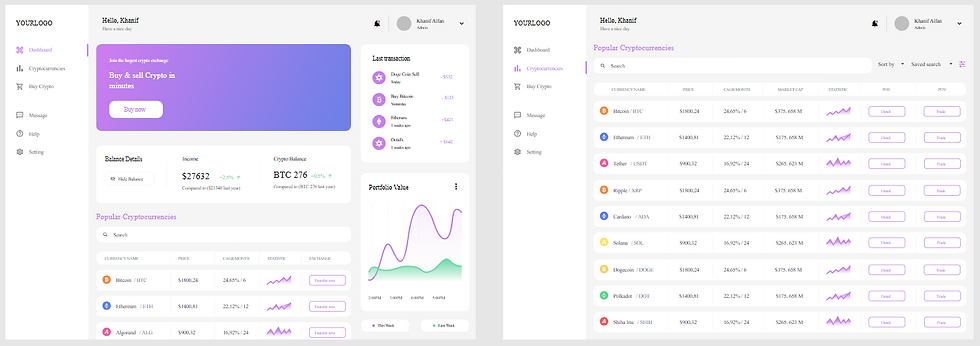
Redesigning old dashboards can breathe new life into your data visualizations, making them more effective and visually appealing. Today, I want to share a practical example of how you can transform your dashboards using some quick win techniques. Let's dive into the redesign journey of two dashboards, illustrated in the image attached.
Why Redesign?
Dashboards evolve over time, and what worked a year ago might not be the best solution today. Redesigning allows you to:
Improve clarity and readability.
Enhance user engagement.
Ensure consistency and best practices.
Update visuals to match current data trends.
Quick Win Techniques for Dashboard Redesign
Here are some quick win techniques that can help you revamp your old dashboards:
Using Containers for Chart Positioning:
Proper use of containers helps in maintaining size and whitespace best practices, ensuring your charts are well-positioned and easy to read.
Consistent Font Sizes and Colors:
Use the same font sizes and colors for titles, tooltips, and labels to maintain a uniform look and feel across the dashboard.
Optimized Label and Number Sizes:
Make label text size smaller and number size bigger to capture attention where it’s needed most.
Formatted and Positioned Legends:
Format and position legends strategically to avoid clutter and enhance readability.
Strategically Positioned Filters:
Place filters in locations that are easy for the user to access and interact with.
Before and After: A Redesign Example
Let’s look at the transformation of two dashboards: "Campaign Pacing" and "Website Metrics".
Campaign Pacing Dashboard
Before:
The dashboard had a cluttered look with inconsistent font sizes and colors.
Charts were not optimally positioned, leading to a lack of clarity.
Legends and filters were not strategically placed, making the dashboard hard to navigate.
After:
Containers were used to improve the layout, ensuring better use of space.
Consistent font sizes and colors were applied to create a cohesive look.
Label text was made smaller, while numbers were made larger for emphasis.
Legends were formatted and positioned to enhance readability.
Filters were strategically placed for easy access.
Website Metrics Dashboard
Before:
Similar issues with clutter and inconsistent design elements were present.
Important metrics were not highlighted effectively.
After:
The layout was restructured using containers to make better use of whitespace.
Consistent fonts and colors were applied across the dashboard.
Key metrics were highlighted with larger numbers, and labels were minimized.
Legends and filters were reorganized to improve user experience.
The Impact of Redesign
The redesigned dashboards not only look more appealing but also provide a better user experience. Users can quickly grasp key insights and interact with the data more efficiently. By applying these quick win techniques, you can transform your dashboards into powerful tools for data visualization.
Conclusion
Redesigning old dashboards is a valuable exercise that can significantly improve their effectiveness. By focusing on layout, consistency, and strategic positioning of elements, you can create dashboards that are both beautiful and functional.
I encourage you to take a look at your existing dashboards and consider applying these techniques. The transformation might surprise you!
Happy visualizing!
Best,
Adrian Zinovei
Feel free to share your thoughts and experiences with dashboard redesign in the comments. Let’s continue to inspire each other with innovative data visualization practices!


Comments